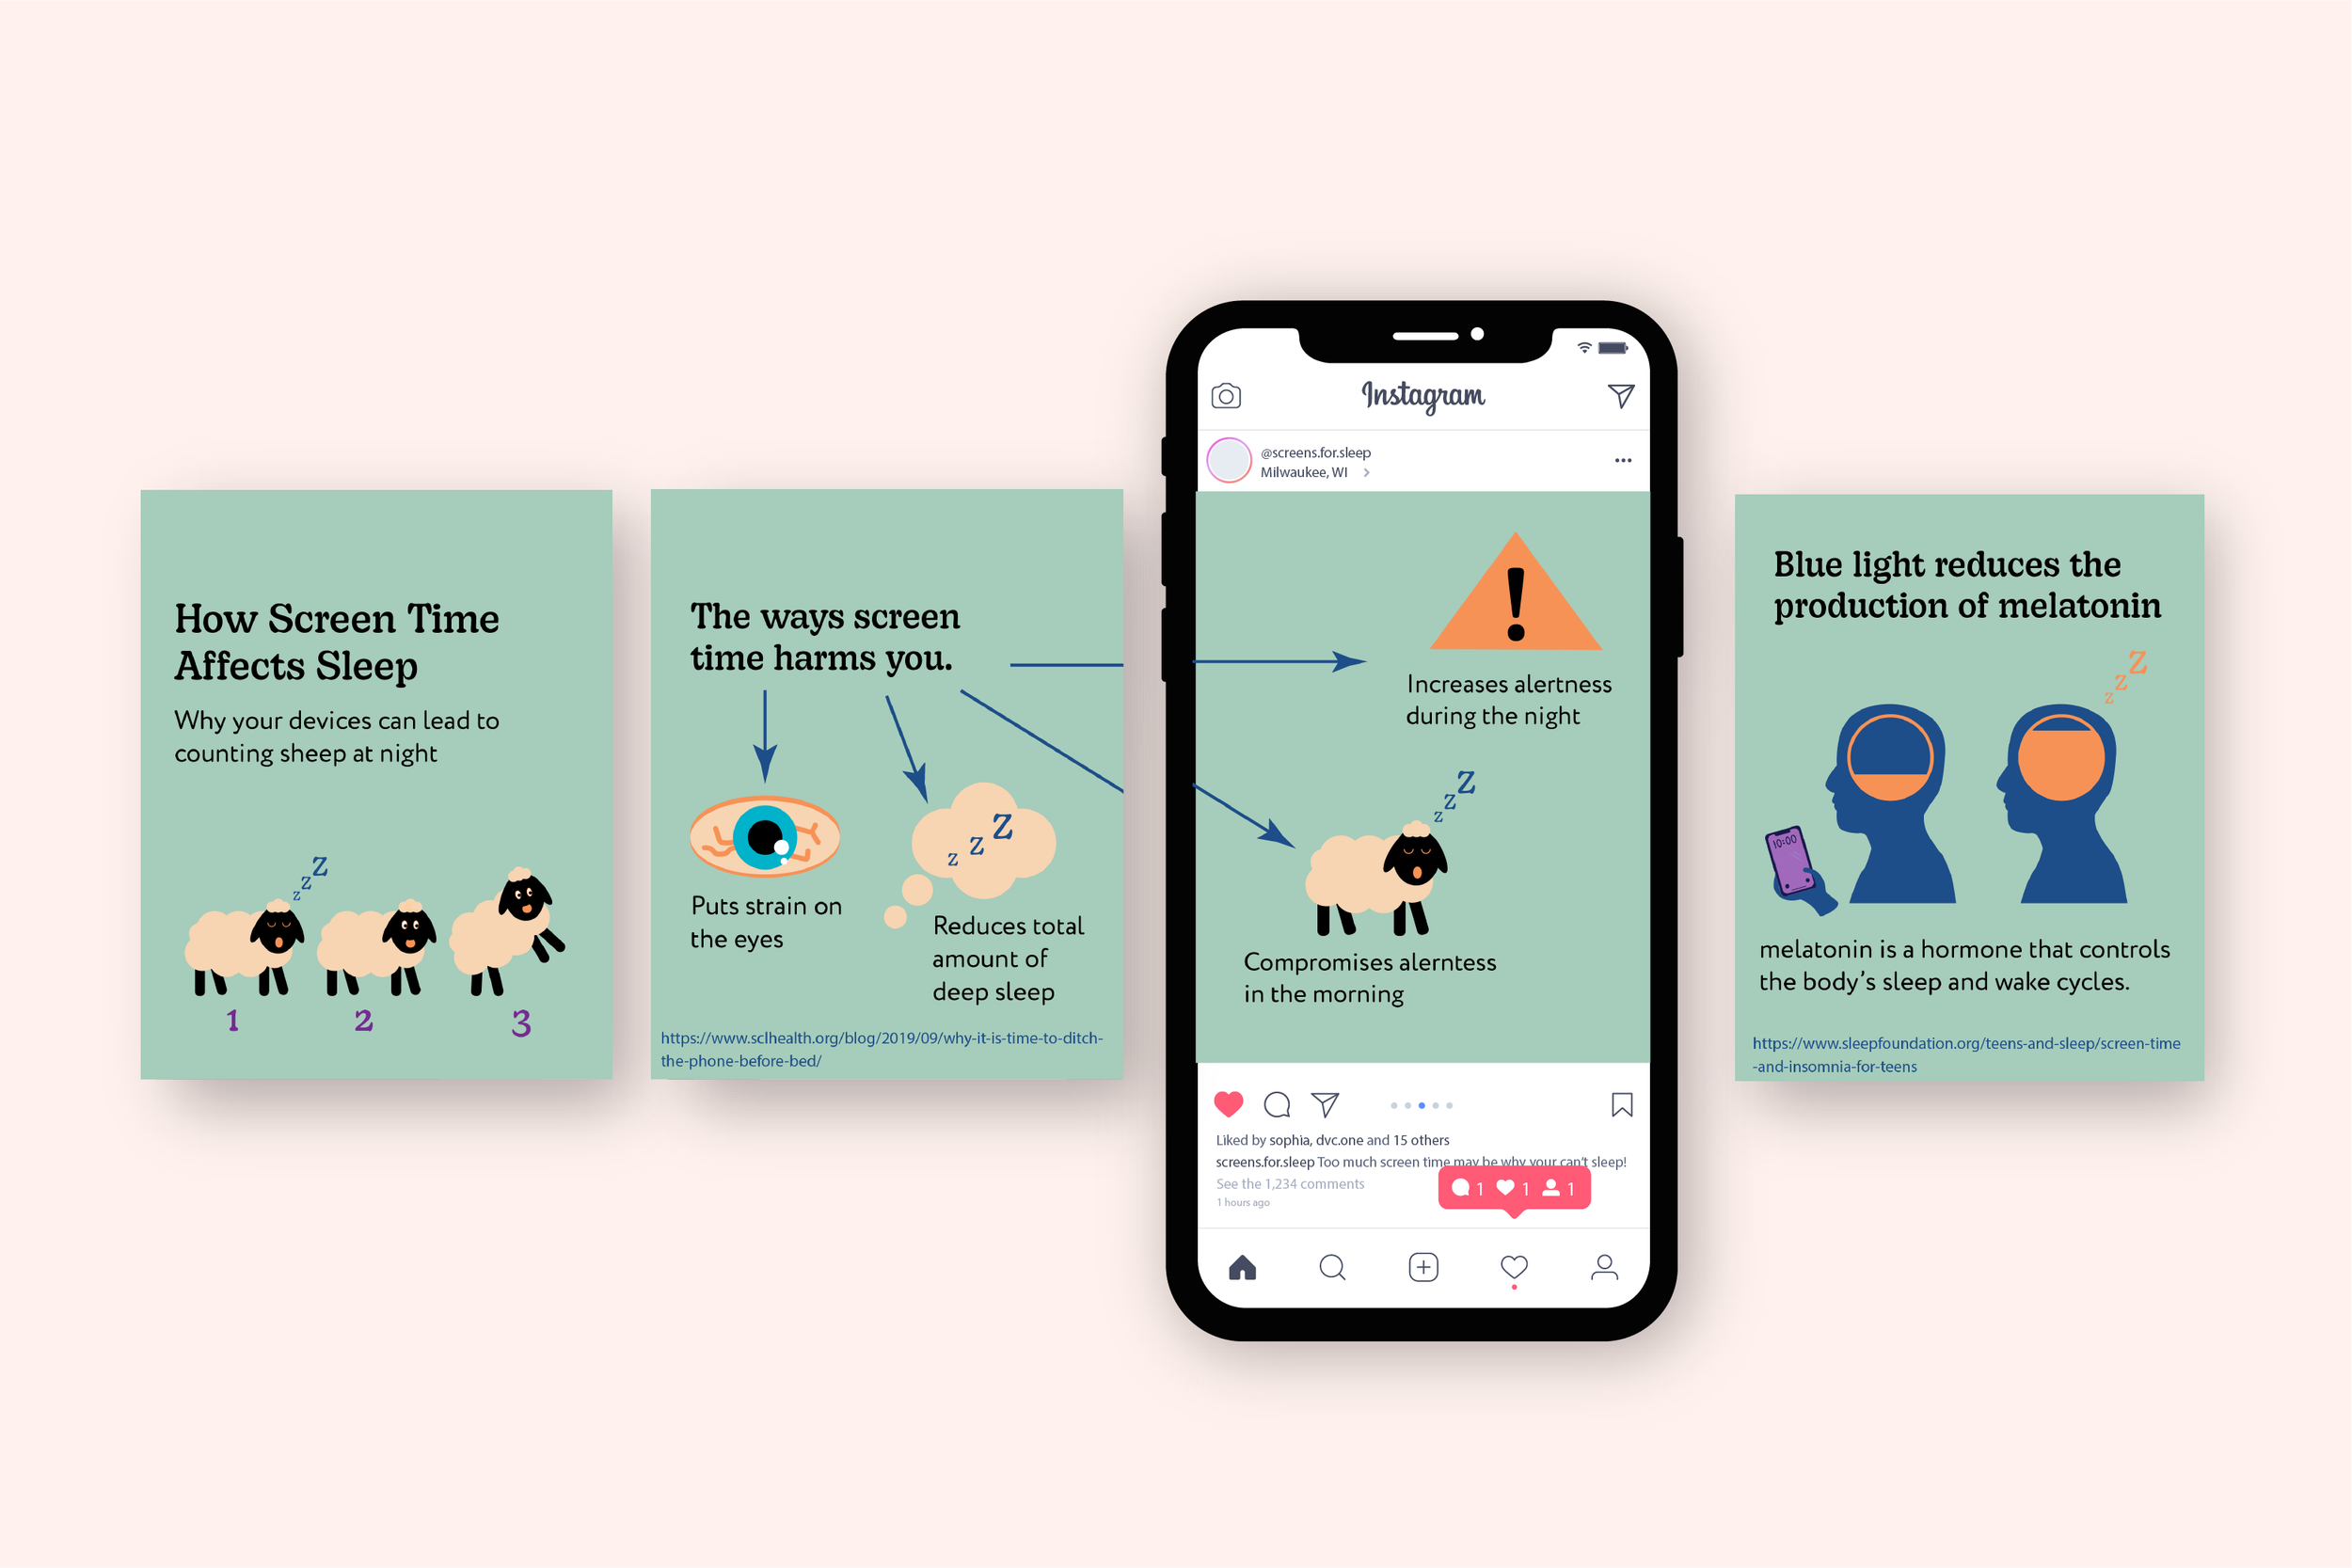
Sleep and Screen Time Infographic
The goal was to create a comprehensive information design program that maps and details “Screen Time” usage. An important aspect was tracking screen time for 7 consecutive days on all devices, including details if this is passive or active screen time and one’s mood during these activities. I have struggled with sleep, so limiting my phone use before bed is something I try to practice. Because I was familiar with this idea, I decided to use sleep and screen time as the story for my infographic. By doing additional research, I found how screen time and blue light affect a person before they sleep. I picked my five different data sets based on that research and began to lay out different charts and graphs. I used Instagram carousel because I feel the people who can be most affected by screen time are college aged. Making sure all the elements were sized correctly for being viewed on a phone and that the flow between frames was engaging was also a concern of mine when working on this project.


